stormwatercenter.net · printed Jul 22, 2026
Pollutant Removal Database
The table above is a searchable summary of how well stormwater treatment practices remove pollutants, drawn from monitored field studies. It pairs the original National Pollutant Removal Performance Database compiled by Winer (2000) — 197 individual practice-and-pollutant records — with a second, clearly labeled layer of 53 design-credit values from the Minnesota Stormwater Manual, so a reviewer can see both the monitored medians and a modern regulatory crediting approach side by side. The notes below explain what the numbers mean, how to read them honestly, what each practice group achieves, and how to use the data in design without over-claiming.
What This Database Shows
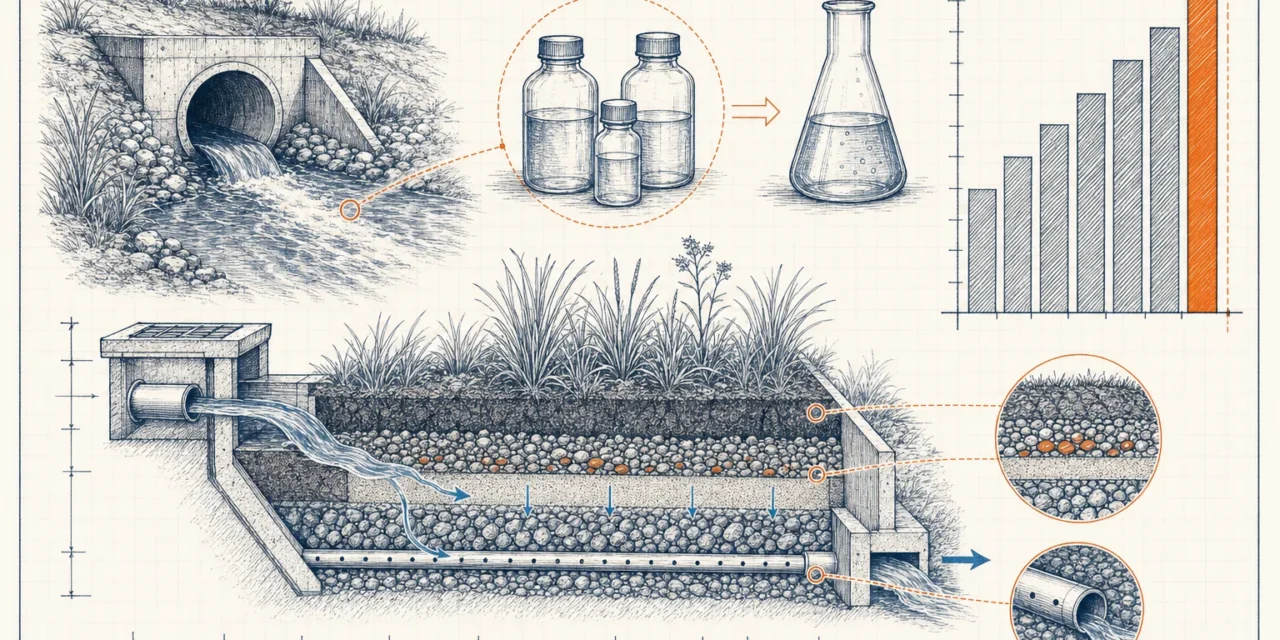
Every row reports a median percent removal for one pollutant by one practice type, with the number of monitoring studies (n) behind it where reported. Percent removal is the reduction in pollutant load or concentration between the inflow and outflow of a practice, averaged across monitored storms. The database is organized by practice group — ponds, wetlands, infiltration, filtering and open channels — and by pollutant, including total suspended solids (TSS), total phosphorus (TP), total nitrogen (TN), soluble phosphorus, nitrate (NOx), copper, zinc, bacteria and hydrocarbons.
The two layers serve different purposes. The Winer (2000) layer is empirical: it aggregates what monitored practices actually achieved, including the scatter (shown as one standard deviation where reported) and the small sample sizes behind some practices. The Minnesota Stormwater Manual layer is regulatory: it gives the assigned median removal credits a reviewer would apply for compliance, including a combined metals credit and design-dependent phosphorus values. Read the empirical layer to understand performance and its uncertainty; read the modern layer to see how a current program translates that performance into design credit.
How to Read the Numbers: Median, Mean and the Limits of Percent Removal
Two cautions govern honest use of this data. First, the database reports medians, not means. The median is the middle value of the monitored studies and is less distorted by a single unusually good or bad site than the average would be; it is the more defensible single number for a practice whose performance varies widely from storm to storm and site to site. The standard-deviation figures in the empirical layer show how wide that variation is — often large relative to the median.
Second, percent removal is a flawed metric at low inflow concentrations, and this is the single most important caveat for using the database. A practice can only remove what comes in. When influent is already clean, even excellent treatment shows a small percent removal — or a negative one — simply because there is little to remove and small amounts of background material can be exported. A high percent-removal figure earned on dirty inflow does not guarantee a clean discharge, and a low figure on clean inflow does not mean the practice failed. For low-concentration sites, the effluent concentration a practice can reach is a more meaningful target than the percent it removes — the idea behind irreducible concentrations discussed below.
Two practices can post the same percent removal and leave very different water behind. Always ask what the inflow concentration was before trusting a removal percentage: 80 percent off a dirty inflow and 80 percent off an already-clean inflow are not the same result. Where a downstream standard is expressed as a concentration, design to the effluent number, not the percentage.
Findings by Practice Group
The grouped medians below summarize the empirical (Winer 2000) layer for the three pollutants that drive most stormwater design — TSS, TP and TN. The full per-practice records, including metals, bacteria and hydrocarbons, are in the table above.

| Practice group | TSS | TP | TN | n |
|---|---|---|---|---|
| Infiltration practices | 95% | 80% | 51% | 6 |
| Filtering practices | 86% | 59% | 38% | 21 |
| Water-quality swales | 81% | 34% | 84% | 9 |
| Stormwater wet ponds | 80% | 51% | 33% | 44 |
| Stormwater wetlands | 76% | 49% | 30% | 39 |
| Stormwater dry ponds | 47% | 19% | 25% | 9 |
Stormwater ponds
Wet ponds are the most heavily monitored group in the database (n=44) and post solid, consistent removals: a median 80 percent TSS, 51 percent TP and 33 percent TN, plus 66 percent soluble phosphorus and 70 percent bacteria. Dry ponds are a different story — without a permanent pool they manage 47 percent TSS, 19 percent TP and 25 percent TN, and they can export soluble phosphorus (a median of about −6 percent). The lesson in the pond rows is that the permanent pool, not the detention volume, is what drives water-quality performance. See the wet pond fact sheet and the dry extended detention pond fact sheet, and browse all pond practices.
Stormwater wetlands
Constructed wetlands (n=39) track close to wet ponds — 76 percent TSS, 49 percent TP, 30 percent TN — with strong nitrate (67 percent) and bacteria (78 percent) removal thanks to biological uptake and longer residence time. The standard deviations are wide, reflecting how much wetland performance depends on vegetation establishment and hydrology. The stormwater wetland fact sheet covers design, and the wetland practices page lists the variants.
Infiltration practices
Infiltration posts the highest medians in the database — 95 percent TSS, 80 percent TP, 51 percent TN, and near-total metals removal (zinc 99 percent) — because runoff that infiltrates is removed from the surface system entirely. The crucial caveat is the sample size: these medians rest on only six studies (n=6), and infiltration performance is wholly dependent on suitable soils and on pretreatment to prevent clogging. Treat the numbers as the ceiling a well-sited, well-maintained practice can reach, not a default. See the infiltration trench fact sheet, the porous pavement fact sheet, and infiltration practices.
Filtering practices
Filtering practices — sand filters, organic filters and bioretention — achieve a group median of 86 percent TSS, 59 percent TP and 38 percent TN (n=21), with very strong zinc removal (88 percent). They also show one of the clearest negative-removal warnings in the dataset: a group median nitrate removal of about −14 percent, because the organic media can nitrify and export nitrate even while capturing other forms of nitrogen. The bioretention fact sheet and sand filter fact sheet detail the designs; see all filtering practices.
Open channels and swales
Water-quality swales — dry and wet swales designed for treatment, excluding plain drainage ditches — show a group median 81 percent TSS and a striking 84 percent TN, but a modest 34 percent TP and a negative bacteria median (about −25 percent), a reminder that vegetated channels are not bacteria-removal practices. Conventional ditches not designed for water quality perform poorly across the board and even export phosphorus. The distinction between a designed swale and a ditch is the whole point of the grass channel fact sheet and the dry swale fact sheet; see open-channel practices.
Removal Efficiency by Pollutant
Reading the database down the pollutant columns rather than across the practice rows reveals which pollutants are easy and which are stubborn. TSS is removed well by almost every structural practice (medians from 47 percent in dry ponds to 95 percent in infiltration) because settling and filtration are effective on particulate matter. Total phosphorus is moderate (roughly 19–80 percent) and tracks with how much fine sediment a practice captures, since phosphorus binds to particles. Total nitrogen is the hardest of the three (often 25–51 percent) because much of it is dissolved, and nitrate specifically can be exported by filtering media. Metals (copper, zinc) are removed well by practices that capture sediment and by infiltration. Bacteria are removed reasonably by ponds and wetlands (about 70–78 percent) but poorly or negatively by swales. Soluble phosphorus is the most variable, exported by some dry ponds and filters and removed well by wet ponds and infiltration.
Why Some Practices Show Negative Removal
Negative removal — more pollutant leaving than entering — appears throughout the database and is a real phenomenon, not a data error. There are three common mechanisms. First, export of soluble nutrients: organic filter media and the sediments of dry ponds and wetlands can release dissolved phosphorus or nitrate, which is why filtering practices show a negative nitrate median and dry ponds a negative soluble-phosphorus median. Second, scour and resuspension: a practice can wash out previously captured sediment during a large storm. Third, the low-inflow effect described above — when influent is already near background, normal variability and the practice’s own materials can tip the measured balance negative. Negative values are most common for the dissolved fractions (soluble phosphorus, nitrate) and for practices not designed to treat them; they are a signal to read the effluent concentration rather than the percent.
Irreducible Pollutant Concentrations
The negative-removal phenomenon points to a deeper principle: every practice has a floor below which it cannot treat, the irreducible concentration. Below that background level, adding more treatment volume yields no further reduction, and a practice receiving already-clean inflow may even export material from its own media or sediment. This is why percent removal collapses as inflow approaches the irreducible concentration, and why design standards increasingly express targets as effluent concentrations rather than removal percentages. The irreducible-concentration data should be preserved and consulted whenever a site’s inflow is already relatively clean, because in that situation a percent-removal target is the wrong metric entirely.
Three Keys to Performance: Concentration, Volume and Total Load
A single removal percentage hides three distinct things a practice does, and good design accounts for all of them. Concentration reduction is what percent removal measures — the drop in pollutant per unit of water. Volume reduction matters independently: a practice that infiltrates or evaporates runoff removes the entire load in that water regardless of its concentration, which is why infiltration scores so high. Total load — concentration times volume, summed over the year — is what the receiving water actually experiences and what most regulations now target. A practice with a modest concentration percentage but large volume reduction can outperform a high-percentage practice that passes all its water through. Estimating load for a specific site is the job of the Simple Method runoff and pollutant-load calculator, which pairs naturally with the removal rates here.
Factors That Influence Performance
The scatter behind every median comes from a handful of recurring factors. Sizing relative to the contributing drainage area sets how much of the annual runoff a practice actually treats. Maintenance — sediment removal, media replacement, vegetation upkeep — is the difference between a practice performing at its median and clogging into failure. Age shifts performance over time as media exhausts or sediment accumulates. Climate and storm size change the inflow: large storms can scour captured material, and cold climates slow biological processes. Inflow concentration, as covered above, governs whether a percent-removal target is even meaningful. A practice selected and sized well but maintained poorly will not reach the numbers in this database. The BMP selector screens practices against site constraints before performance is even considered.
State Removal Criteria and Compliance Use
Reviewers use removal numbers in two ways. Some state programs publish required removal efficiencies — a practice must achieve, say, 80 percent TSS and a set phosphorus reduction to receive credit — and a designer demonstrates compliance by selecting practices whose credited removals meet the threshold. Other programs assign fixed design credits per practice, the approach the Minnesota Stormwater Manual layer in this database represents. Either way, the database supports the justification step: it shows the monitored basis for a credited number and the uncertainty around it. Because criteria differ by state — and because some express targets as concentration rather than percent — the governing manual for the project’s jurisdiction always controls, and these medians serve as supporting evidence rather than a substitute for the local standard.
Data Sources and Methodology
The empirical layer is the Winer (2000) National Pollutant Removal Performance Database, 2nd edition: median percent removals compiled from monitored field studies, with study counts and standard deviations as reported. The values here are drawn from its summary tables. The modern layer is a set of assigned median removal credits from the Minnesota Stormwater Manual, included to show how a current regulatory program credits the same practices; its metals value is a combined credit and some phosphorus values are design-dependent, as noted in the rows. Both layers are labeled at the source level in the table so users never blend an empirical median with a regulatory credit by accident. Practitioners citing these figures should cite the original source named in the row — Winer (2000) or the Minnesota Stormwater Manual — rather than this page, and should report the study count alongside any median so the reader can weigh its reliability.
Reference this database
Frequently asked questions
What are the five solutions to reduce urban runoff?
At the practice level the main structural groups are ponds, wetlands, infiltration, filtering practices (including bioretention and sand filters) and open-channel practices (water-quality swales). The most effective approach combines source reduction — less impervious cover — with one or more of these treatment practices sized for the site.
What is BMP pollutant removal efficiency and how is it measured?
It is the reduction in pollutant load or concentration between a practice’s inflow and outflow, usually expressed as a percent and averaged across monitored storms. It is measured by sampling event mean concentrations in and out of the practice over many storms; this database reports the median of those monitored results.
Which pollutants are most commonly targeted by stormwater BMPs?
Total suspended solids (TSS), total phosphorus, total nitrogen, metals (copper and zinc), bacteria and hydrocarbons. TSS and phosphorus drive most design because they are widely regulated and because capturing sediment removes much of the particulate-bound pollution.
Which BMP has the highest pollutant removal efficiency?
In this database infiltration practices show the highest median removals (95 percent TSS, 80 percent phosphorus), because infiltrated runoff is removed from the surface system entirely. That figure rests on only six studies and depends on suitable soils and pretreatment, so it is a ceiling rather than a default.
How well do retention ponds remove phosphorus?
Wet (retention) ponds show a median total-phosphorus removal of about 51 percent across 44 studies, plus about 66 percent soluble phosphorus. The permanent pool is what drives this; dry ponds without a permanent pool manage only about 19 percent and can export soluble phosphorus.
What is TSS in stormwater?
TSS stands for total suspended solids — the sediment and particulate matter carried in runoff. It is the most commonly measured stormwater pollutant because many other pollutants, including much phosphorus and metals, bind to particles, so removing sediment removes them too.
How does bioretention compare to sand filters for nutrient removal?
Both are filtering practices with strong TSS and good phosphorus removal. Performance for nitrogen is more variable, and filtering media can export nitrate — the filtering group shows a negative nitrate median — so neither is a reliable nitrate-removal practice without specific design measures. Compare the bioretention and sand filter fact sheets for the design differences.
Why can a BMP show negative removal efficiency?
Because more pollutant can leave than enters. This happens when media or sediment export dissolved nutrients (filters exporting nitrate, dry ponds exporting soluble phosphorus), when a storm scours previously captured sediment, or when inflow is already so clean that normal variability tips the measured balance negative. It is a real phenomenon, common for dissolved fractions.
What are irreducible pollutant concentrations?
The background level below which a practice cannot treat. Below that floor, more treatment volume yields no further reduction, and a practice receiving clean inflow may even export material. It is why percent removal collapses at low inflow concentrations and why some standards set effluent-concentration targets instead.
How do state regulations set required removal efficiencies?
Programs take two main approaches: requiring a practice to meet a removal threshold (such as 80 percent TSS) for credit, or assigning fixed design credits per practice type, as the Minnesota Stormwater Manual layer does. The governing manual for the project’s jurisdiction always controls; databases like this one provide the supporting evidence.
Does BMP efficiency change with storm size?
Yes. Large storms can exceed a practice’s treatment volume and pass or even scour runoff, lowering measured removal, while small storms are often treated more completely. Reported medians average across a range of monitored storms, which is part of why the standard deviations are wide.
How does maintenance affect pollutant removal performance?
Substantially. Sediment removal, media replacement and vegetation upkeep are what keep a practice performing at its median; neglected practices clog, lose capacity and can export captured material. A well-selected, well-sized practice that is poorly maintained will not reach the numbers in this database.
Can removal efficiencies of BMPs in series be added together?
No. Removals do not simply sum. A second practice in a treatment train acts on the already-cleaner outflow of the first, so it captures a percentage of a smaller load and yields diminishing returns — and as inflow approaches the irreducible concentration, the marginal removal falls toward zero. Treatment-train credit must be calculated on the load passed between practices, not added.
Where does the data in this database come from?
From two labeled sources: the Winer (2000) National Pollutant Removal Performance Database, 2nd edition (monitored median removals from field studies), and a layer of assigned design credits from the Minnesota Stormwater Manual. Each row identifies its source so empirical medians and regulatory credits are never blended by accident.
How is percent removal different from effluent concentration?
Percent removal is the reduction relative to inflow; effluent concentration is the absolute quality of the discharge. A high percent on dirty inflow can still leave a poor effluent, and a low percent on clean inflow can still meet a concentration standard. Where a downstream target is a concentration, design to the effluent number rather than the percentage.
Who verifies a BMP’s claimed removal efficiency for approval?
The reviewing authority — typically a state or local stormwater program — sets which credited removals it will accept, usually through its design manual. Independent monitoring databases such as this one and the original Winer (2000) source provide the field evidence behind those credited numbers, but the approving agency’s manual governs what may be claimed.