It is widely recognized that in order to meet various in-stream water quality monitoring standards and classifications, it is necessary to provide some level of stormwater treatment.� The water quality volume attempts to capture the majority of the pollutants moving off the land surface.� The goal of water quality sizing criteria is to capture and treat the majority pollutants in stormwater runoff, while maintaining a reasonable cost for stormwater treatment practices.
In this section, we present basic options for stormwater quality control, provide default criteria, and discuss tools of analysis to evaluate site pollutant loads.
Basic Options for Water Quality
90 % Rainfall Event:
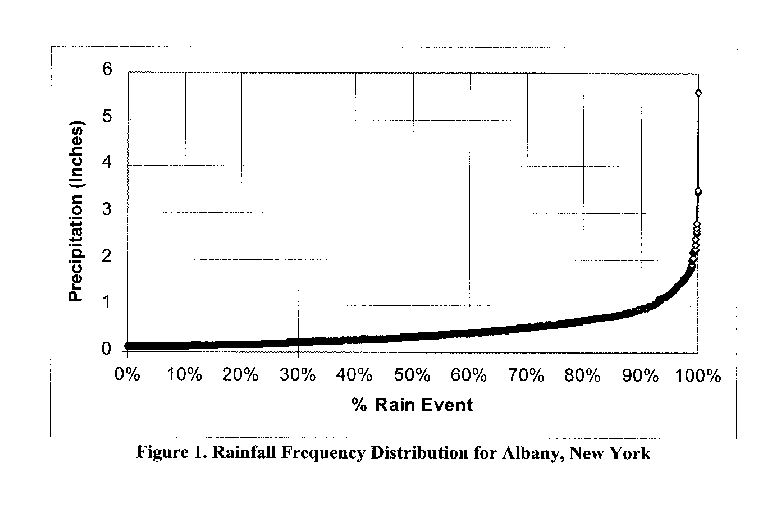
In this option, the water quality volume is equal to the storage required to capture and treat approximately 90% of the average annual stormwater runoff volume.� The specific rainfall event captured is the 90% storm event, or the storm event that is greater than or equal to 90% of all 24-hour storms on an annual basis.� This value is determined by investigating local rainfall records to develop a rainfall frequency spectrum.� The rainfall frequency spectrum represents the statistical distribution of 24-hour rainfall events. Figure 1 illustrates a rainfall frequency spectrum for Albany, New York.� This value varies regionally, based on local rainfall patterns. Table 1 illustrates some typical 90% rainfall events for various cities in the United States.
![]() Typically,
rainfall events less than 0.1� are eliminated from the rainfall frequency spectrum
analysis.
Typically,
rainfall events less than 0.1� are eliminated from the rainfall frequency spectrum
analysis.
![]() Please
note that the 90% rainfall event is not calculated based on the annual volume,
but rather as a percentile of individual events.� One concern is that this event
may not in fact capture 90% of the annual runoff volume.� Staff at the Center
for Watershed Protection investigated this concern for rainfall stations in
New York, Vermont, and Georgia.� Assuming that all storms smaller than the water
quality storm are captured, and that the water quality volume is captured for
larger storm events, the criteria did capture roughly 90% of the annual runoff
volume for all stations analyzed.� In areas with radically different hydrology,
such as regions with frequent hurricanes, or in desert climates, this analysis
may not yield the same results.
Please
note that the 90% rainfall event is not calculated based on the annual volume,
but rather as a percentile of individual events.� One concern is that this event
may not in fact capture 90% of the annual runoff volume.� Staff at the Center
for Watershed Protection investigated this concern for rainfall stations in
New York, Vermont, and Georgia.� Assuming that all storms smaller than the water
quality storm are captured, and that the water quality volume is captured for
larger storm events, the criteria did capture roughly 90% of the annual runoff
volume for all stations analyzed.� In areas with radically different hydrology,
such as regions with frequent hurricanes, or in desert climates, this analysis
may not yield the same results.
Table 1.� 90% Rainfall Event for Select U.S. Cities |
|
City |
Rainfall (Inches) |
|
Columbus, OH |
1.0 |
|
Albany, NY |
0.9 |
|
New York, NY |
1.2 |
|
Frederick, MD |
1.1 |
|
Washington, D.C. |
1.2 |
|
Boise, ID |
0.5 |
|
Phoenix, AZ |
0.8 |
|
Denver, CO |
0.7 |
|
Austin, TX |
1.4 |
|
Savannah, GA |
1.5 |
|
Montpelier, VT |
0.9 |
|
Los Angeles, CA |
1.3 |
![]() When
applying the 90% rule to large geographic areas, several stations should be
analyzed, because rainfall patterns may vary within the jurisdiction.� This
analysis may result in different sizing criteria between geographic regions.
A stormwater design manual should include a map depicting the required water
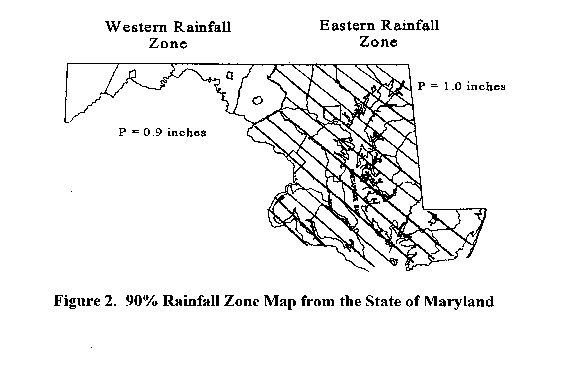
quality volume required in each geographic region. Figure 2 illustrates a 90%
rule map for Maryland.
When
applying the 90% rule to large geographic areas, several stations should be
analyzed, because rainfall patterns may vary within the jurisdiction.� This
analysis may result in different sizing criteria between geographic regions.
A stormwater design manual should include a map depicting the required water
quality volume required in each geographic region. Figure 2 illustrates a 90%
rule map for Maryland.
One-Inch Sizing:
This option is very similar to the 90% sizing option, except that it applies one rainfall volume arbitrarily.� As Table 1 indicates, the actual 90% event may vary significantly between cities.
Half-Inch Rule:
This option is based on the "First Flush" concept, which states that the majority of the pollutants carried in urban runoff are carried in the first half-inch of runoff. This volume is calculated by multiplying 0.5 inches by the total site area. This criterion results in a sizing rule that is perhaps more than is needed for relatively pervious sites, but inadequate for highly impervious ones.� One study in Austin, TX (Chang et al., 1990) found that half-inch rule sizing resulted in 100% capture of the total solids load for sites at 10% impervious cover, but only 75% for 50% impervious sites, and 43% for 90% impervious ones.
On-Site Load Calculation:�
In this option, the goal is to reduce post development loads by a certain amount. Options used in several areas include reducing pollutant loads for a specific parameter to predevelopment levels, reducing pollutant loads to a certain baseline condition (e.g., the Phosphorus load associated with 15% imperviousness).�� Examples of these requirements include the Maryland Critical Areas, the New York City Reservoir, and the Chesapeake Bay Resource Protection Areas (VA).
![]() Other
sizing options for water quality are used throughout the United States.� This
summary represents only the most common criteria.
Other
sizing options for water quality are used throughout the United States.� This
summary represents only the most common criteria.
The
WQv� shall be equal to:
�(P1)
(Rv)(A)/12
Where:
�����������
P1 ����� = ����������90% Rainfall Event (Inches)
�����������
RV������� =����������� Runoff Coefficient
�����������
A�������� =����������� Site Area (acres)
RV����������� =����������� 0.05+0.009I
Where:
�����������
I���������� =����������� Site Impervious Cover (%)
![]() This
equation uses the runoff coefficient (RV), described in the Simple
Method.� Other simple regressions or methods could be used as a substitute
to calculate the runoff volume.� Regressions based on local data are preferred.
This
equation uses the runoff coefficient (RV), described in the Simple
Method.� Other simple regressions or methods could be used as a substitute
to calculate the runoff volume.� Regressions based on local data are preferred.
For quantity-based water quality sizing criteria, several simple regressions can be used to calculate the runoff volume.� A few methodologies for methods that calculate on-site loads include:
n The Simple Method is a simple way of calculating runoff and pollutant loads based on impervious cover, rainfall and event mean concentration (EMC) data for different water quality parameters. This model has been expanded to incorporate subsurface flows as well in the Simplified Urban Nutrient Output Model (SUNOM). Click here for a more detailed description of the Simple Method.
n SWIMM is a model developed by the EPA for analyzing stormwater quantity and quality associated with runoff from urban areas. Both single-event and continuous simulation can be performed on catchments having storm sewers, or combined sewers and natural drainage, for prediction of flows, stages and pollutant concentrations. http://www.epa.gov/ceampubl/swmm.htm
n SLAMM This model is based on small storm hydrology and pollutant runoff from urban land uses.� Pollutant sources are identified and both structural and nonstructural stormwater practices can be accounted for in the model.� http://wi.water.usgs.gov/slamm/
![]() This
list represents only a small fraction of water quality models.� For more general
information on water quality models, go to http://www.epa.gov/ceampubl.
This
list represents only a small fraction of water quality models.� For more general
information on water quality models, go to http://www.epa.gov/ceampubl.